Details
File Name: bubble.zip
Date Published: 12/24/2019
File Size: 111 KB
The archive contains the following files:
bubble.vss - the template for Visio 2007, 2010
bubble.vssm - the template for Visio 2013 and later version
data.txt - text data example
data.xlsx - Excel data example
The stencil contains the master and macros needed to automatically create a Bubble Graph. Macros are called through the context menu of the shape.
Shape stores data and can be switched both to data display and chart display. Switching through the context menu.
Data can be entered via the clipboard or imported from an external text or Excel file.
Data format
Sample data is shown in the picture.
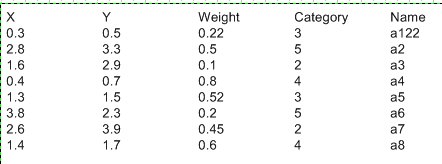
Lines must be separated by a line feed.
The columns in the row are separated by the tab character.
The data contains the following columns:
X, Y coordinates
Weight - transforms into bubble size
Category - transforms into bubble color
Name - displayed as the label of the bubble
Install Instructions
1. Download the archive and unzip it
2. Copy the appropriate stencil file to the "My Shapes" folder in your "Documents" or "My Documents" folder, which will be located on a path that looks similar to this:
C:\Documents and Settings\yourname\My Documents\My Shapes
or:
C:\Users\yourname\Documents\My Shapes
You must use .vss for Visio 2010 and earlier or .vssm for Visio 2013 and later versions.
Using a stencil
Open the stencil in the Shapes window. In Visio 2007 go to the File menu, point to Shapes, and then point to My Shapes. In Visio 2010 and later, click on More Shapes in the Shapes window, and then point to My Shapes. The stencils will be listed in the My Shapes menu.
Transfer the master shape from the stencil to the drawing page.
You can use the context menu for calling functions and the Shape Data window for setting parameters.
Functions of the context menu:
Show Data - switches to data view
Show Graph - switches to chart view
Redraw Graph - deletes a chart and draws it again
Show Weight - Turns the weight display as a text label on and off
Show Name - Turns the name display as a text label on and off.
Import from Text File - import data from a text file
Import from Excel File - import data from an Excel file
Parameter control through the Shape Data window:
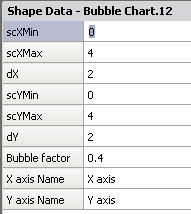
scXMin, scXMax - X-axis range
dX - distance between grid divisions along the X axis
scYMin, scYMax - Y-axis range
dY - distance between grid divisions along the Y axis
Bubble factor - coefficient for bubble diameter
X axis Name, Y axis Name - axis names.
System Requirements
To use this stencil, you must have desktop version Microsoft Visio 2007 or a later version. Both professional and standard versions are suitable.
Windows XP 7 and later.
If you need to change the functionality, write comments.